

The Activity Monitor app can be used to troubleshoot your Mac, as well as evaluate how well your Mac is performing overall or with specific running processes (apps). In Using Activity Monitor Part 2, we’ll take a look at using this utility to explore your Mac’s energy use, disk performance, and network performance.
In Activity Monitor Part 1, we looked at the basics of using the app, and examined how to use the app to monitor CPU and RAM utilization. If you’re not familiar with how to use Activity Monitor, you may want to take a few moments to check out Using Activity Monitor Part 1: CPU and Memory.
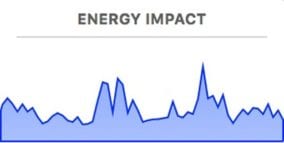
Energy Tab in Activity Monitor
The Energy tab measures the overall energy use of your Mac, as well as on a per process (app) basis. For those of us with MacBooks, the Energy section of Activity Monitor can help us manage the MacBook’s battery runtime by discovering which processes are using excessive amounts of the battery’s energy.
The Energy tab is also useful for those of us with desktop Macs, or who have our MacBooks plugged into the mains (AC). In those cases, the Energy tab can help us discover processes that are using a lot of energy and likely causing our Macs to heat up and run the internal fans, with an annoying high-speed whine.
The Energy tab displays a hierarchical view of processes, with related processes displayed together. An example: If you have multiple Safari pages open (and who doesn’t?), they will show up as a single “Safari” process. But the process can be expanded by clicking on its disclosure triangle to reveal each individual Safari process that is running.
This allows you to dig down through related processes to find the one that’s the energy hog. It also helps keep the tab well organized.
Activity Monitor displays how each group and individual process is affecting your Mac’s energy use using the following categories:
- Energy Impact: Measures the current energy consumption of the app (lower numbers are better).
- Avg Energy Impact: The average impact the app has had on energy consumption over the last 8 hours, or since the Mac was started up, whichever is shorter.
- App Nap: Status of App Nap capabilities of the selected app.
- Preventing Sleep: Shows if the app is preventing your Mac from sleeping.
- Requires High Perf GPU: If your Mac has multiple GPUs, this category displays if the app requires the higher performance GPU, thus requiring more energy use.
- User: The owner of the running process.
At the bottom of the display you’ll see overall totals for energy in the following categories:
- Energy Impact: A graph showing energy use over time.
- Graphics Card: The current graphics card in use.
- Remaining charge: Percent of remaining battery charge.
- Time until full: The amount of time needed to fully charge the battery.
- Time on AC: Time elapsed since the Mac was plugged into an AC outlet.
- Time remaining: Estimate of the amount of time available from the battery.
- Time on battery: The elapsed time that you’ve been powering the Mac from the battery.
- Battery: The battery charge level over the past 12 hours.
Note: The energy categories shown are dependent on the type of Mac you have and the hardware it contains.

About Energy Impact and Avg Energy Impact: Apple has to do some guesswork to determine the amount of energy used on a process-by-process basis. There is no hardware within the Mac that can directly make these types of measurements, but it can be derived from measuring CPU and GPU impact, as well as wakeup impact and App Nap impact. There are also disk and network impacts that have to be included to produce the Energy Impact and Avg Energy Impact numbers.
You should only use the Energy Impact numbers as a guide, and not an exact representation of energy consumed by a process.
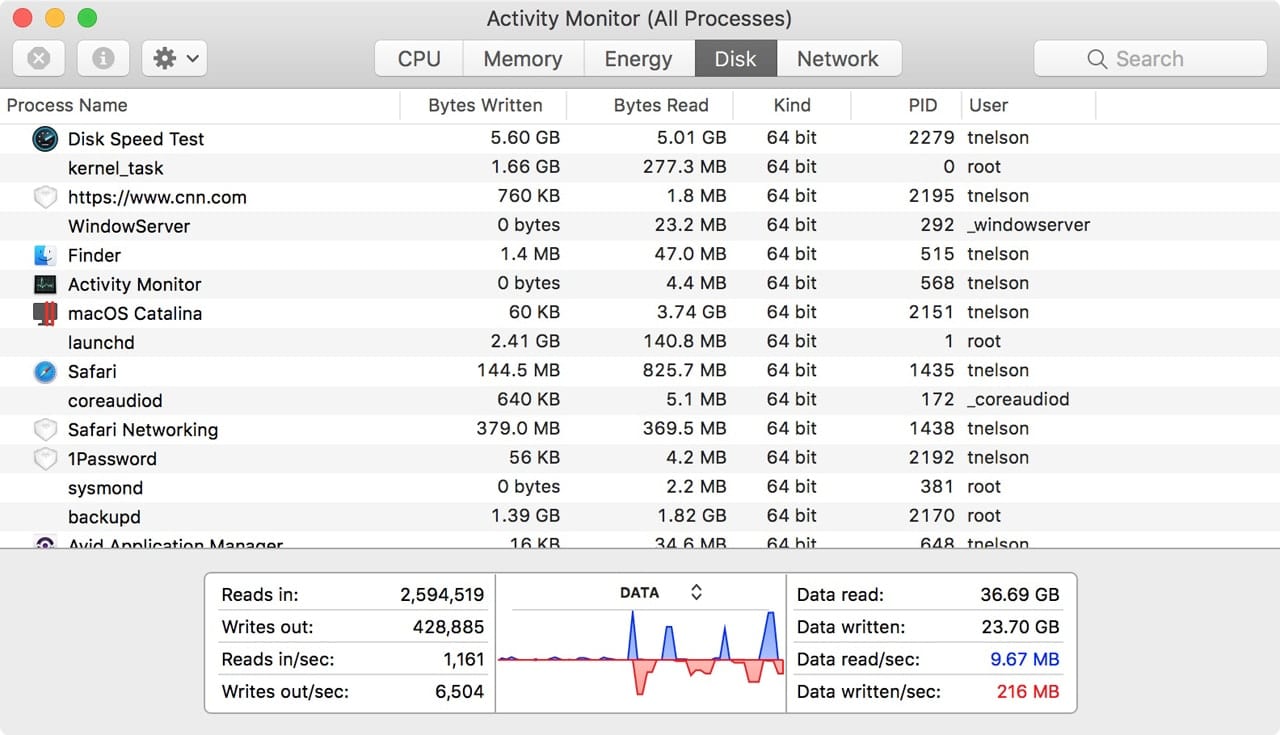
Disk Tab in Activity Monitor
The Disk section of Activity Monitor measures how much data each process has read from and written to your storage device. Besides the amount of data, the number of read ins and write outs (IO), essentially how many times the storage system is accessed, are also tracked.
Together the data and IO numbers give you a good read of how well your storage system is performing. When you select the Disk tab, you’ll see the following categories for each listed process:
- Bytes Written: The total number of bytes written by the process to the storage device.
- Bytes Read: The number of bytes read by the process from the storage device.
- Kind: Displays whether the app is 32-bit or 64-bit.
- PID: A unique number assigned as an ID to each process.
- User: The owner of the process.
At the bottom of the display are total values for the following categories:
- Read in: The total number of times a read from the storage device has occurred.
- Writes out: The number of times data has been written to the storage device.
- Read in/sec: The rate of read operations performed (IO).
- Write out/sec: The rate of write operations performed (IO).
- Data read: The total of data read from the storage device.
- Data written: The total of data written to the storage device.
- Data read/sec: The speed at which data read is occurring.
- Data written/sec: The speed at which data is written to the storage device.
- History Graph: The history graph shows either how much data is transferred over time, or how often (IO) the storage device is accessed. You can select which is shown, Data or IO, by using the popup menu on top of the graph.
Note: The values displayed in the disk tab are an amalgam of all accesses to any storage device connected to your Mac. It’s not limited to just the startup device.
You can use the Disk tab to evaluate how well your storage system is working. If you’re experiencing performance issues, you may want to monitor the Reads in/sec and Writes out/sec to see if there is excessive disk utilization. If you can discover what is causing the high utilization, you can make changes to reduce the IO bottleneck.
Some common examples are insufficient RAM causing paging, the swapping of data between RAM and disk, or a disk-intensive app, which may benefit from a faster storage device. Drives with insufficient free space cause your Mac to wait on a disk as space is reallocated.
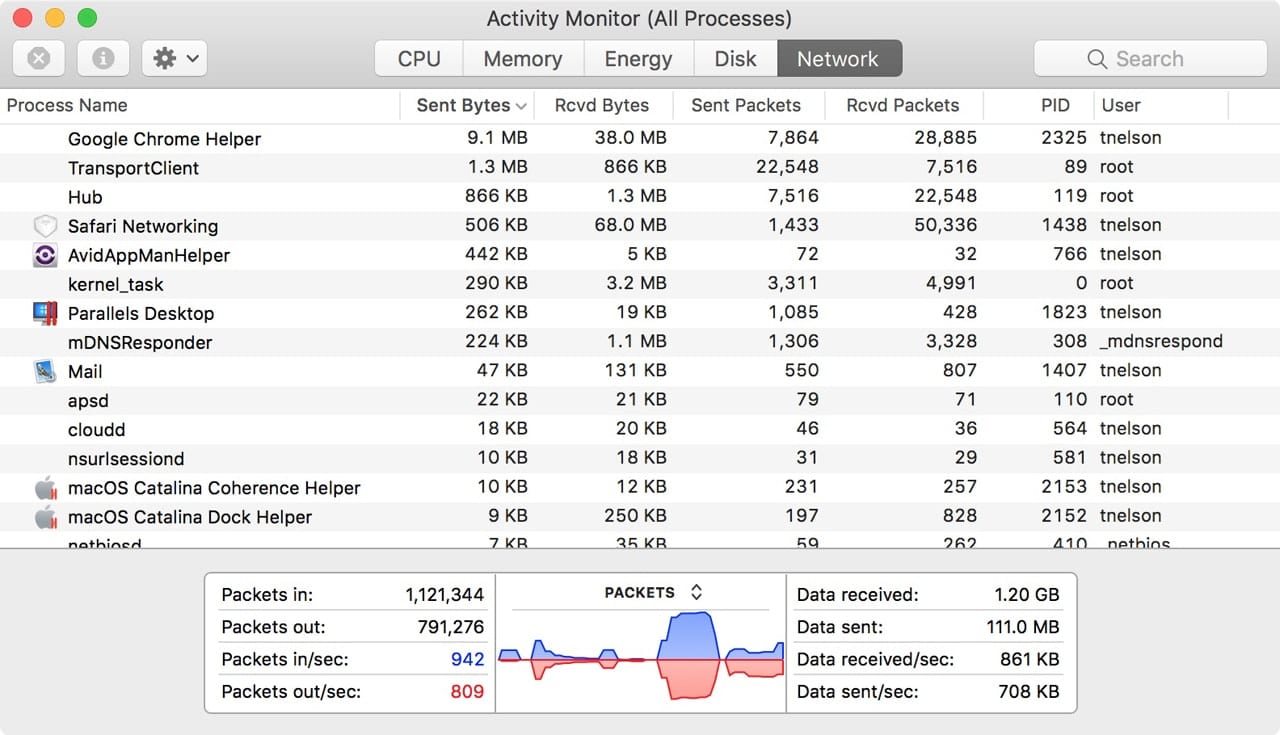
Network Tab in Activity Monitor
The Network tab displays how much data your Mac is sending and receiving over your network. This tab can be used to identify apps that are heavy users of your network.
The Network tab displays each process and how it affects your network in the following ways:
- Sent Bytes: Data sent by the process to the network.
- Received Byes: Data received by an app from the network.
- Sent Packets: Packets sent by an app to the network.
- Rcvd Packets: Packets received by an app from the network.
- PID: Unique process identification number.
- User: The owner of the process.
At the bottom of the Network tab are categories for network totals:
- Packets in: Total number of packets received.
- Packets out: Total number of packets sent.
- Packets in/sec: The number of packets received in one second.
- Packets out/sec: Number of packets sent in one second.
- Data received: Total amount of data received from the network.
- Data sent: Total amount of data sent to the network.
- Data received/sec: Amount of data received within one second.
- Data sent/sec: Amount of data sent to the network in one second.
- History Graph: The history graph can show either packets sent and received per second, or data sent and received per second. You can select which is displayed by using the dropdown menu at the top of the graph.
Note: Packets are structures for carrying data across a network; they usually contain a header, body (the data), trailer, and checksum (CRC).
If you’re having network performance issues, check to see if one or more apps are hogging the network connection. Also, check the history graph to see if you’re sending or receiving information over the network
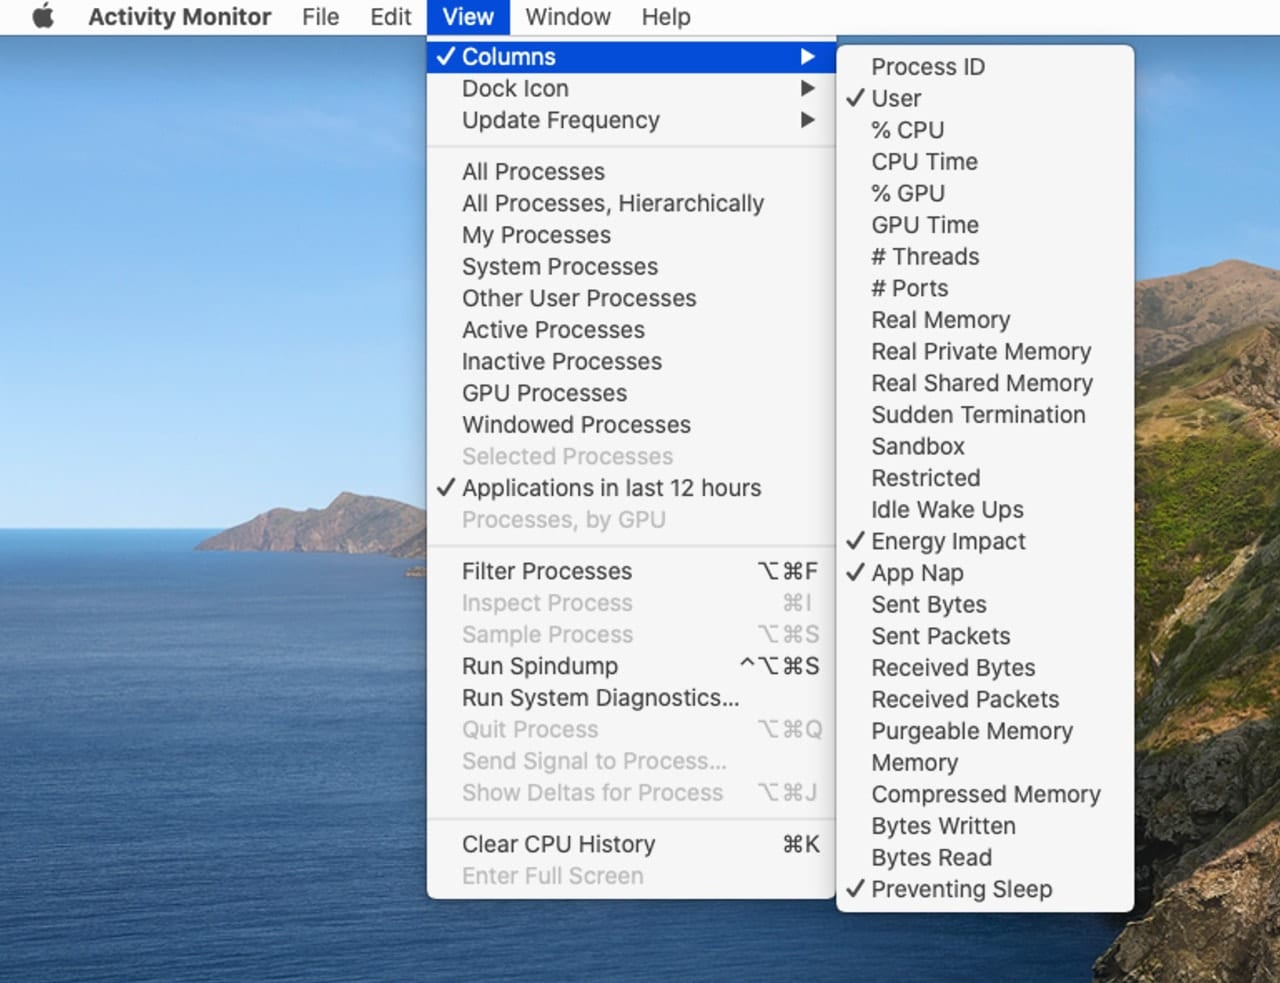
Customizing Activity Monitor
Activity Monitor offers a few ways to customize the app; most can be found under the View menu, with three items (Columns, Dock Icon, and Update Frequency) the ones most often manipulated by the user. We covered Dock Icons in Part 1 of this guide, so we’ll examine the other two in this part of the guide.
Columns: The Columns menu item allows you to add or remove various categories from the currently selected tab. Some examples for various tabs:
- Memory tab: The memory tab can display a number of memory-related categories, which aren’t usually shown. You may find adding Purgeable Memory helpful for seeing if an app that looks to be a memory hog actually has some of the memory marked as purgeable, able to be used by other apps if the need arises.
- Energy tab: The Energy tab can be used to find processes that are causing heat issues with your Mac. To find the types of apps that are causing your Mac’s fan to spin faster, you can add % CPU and & GPU categories to the energy tab to help troubleshoot the issue. The apps having a high-energy impact, and using a large percentage of the CPU or GPU, are likely to be the ones spinning up your Mac’s fans.
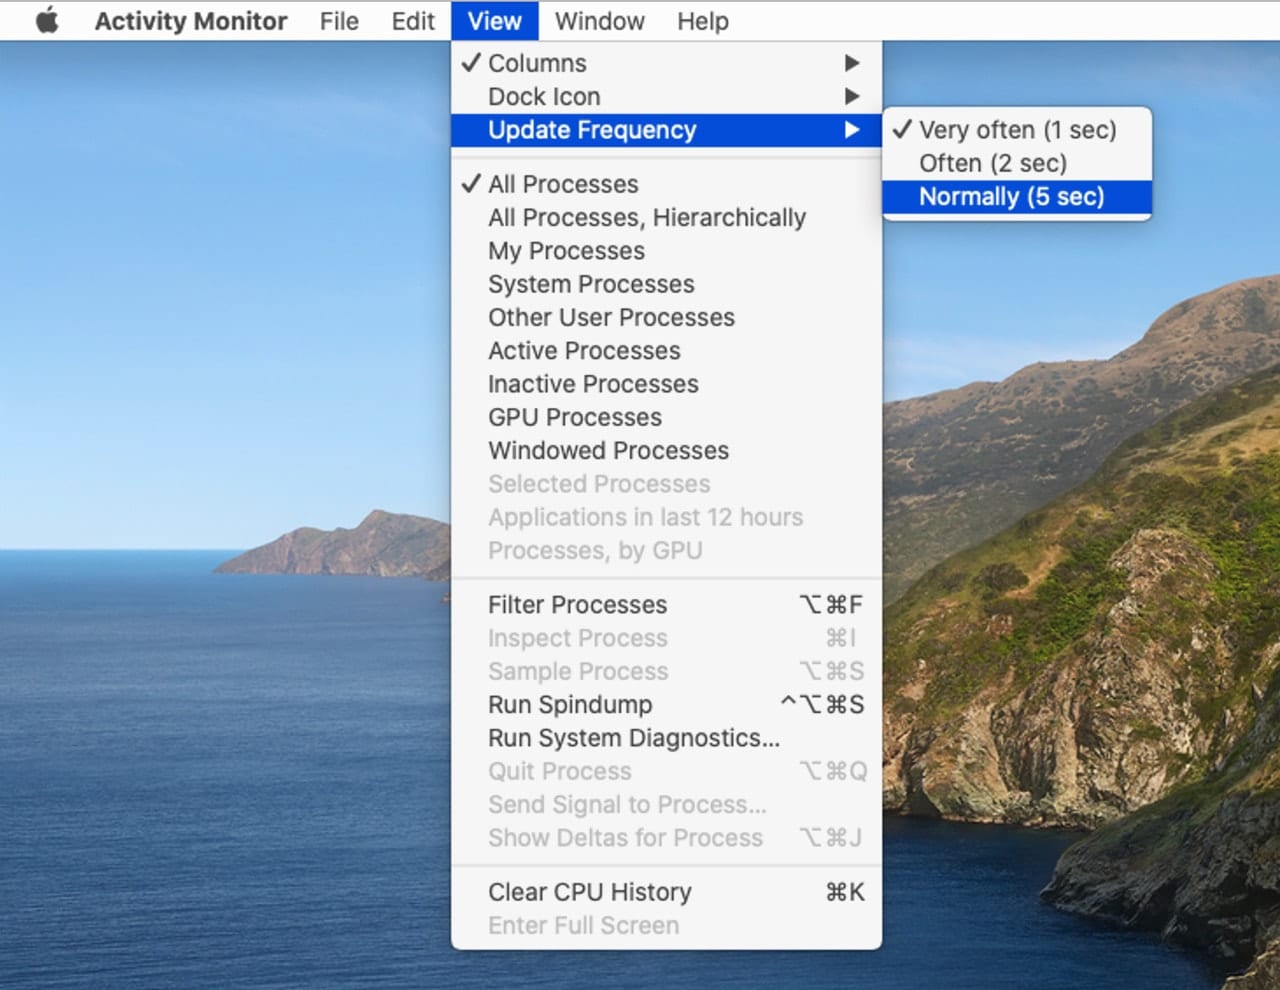
Update Frequency: This menu item allows you to set how often Activity Monitor updates the values for all the processes. You can pick from three update periods:
- Very Often: When selected, Activity Monitor will update every second. It can be especially helpful when using any of the Activity Monitor graphs to monitor various events. On the downside, you’ll probably notice Activity Monitor becoming a resource hog on its own.
- Often: This will set the update period to every 2 seconds, and is a good choice when you’re monitoring numerical value updates of a process. It still increases the load on your Mac, but not as much as the Very Often setting.
- Normal: Updates once every 5 seconds. This is the default setting, and is good for general use of the Activity Monitor app.
Quitting and Force Quitting Processes
You can quit or force quit an app directly from within the Activity Monitor app. To terminate a process, follow these steps:
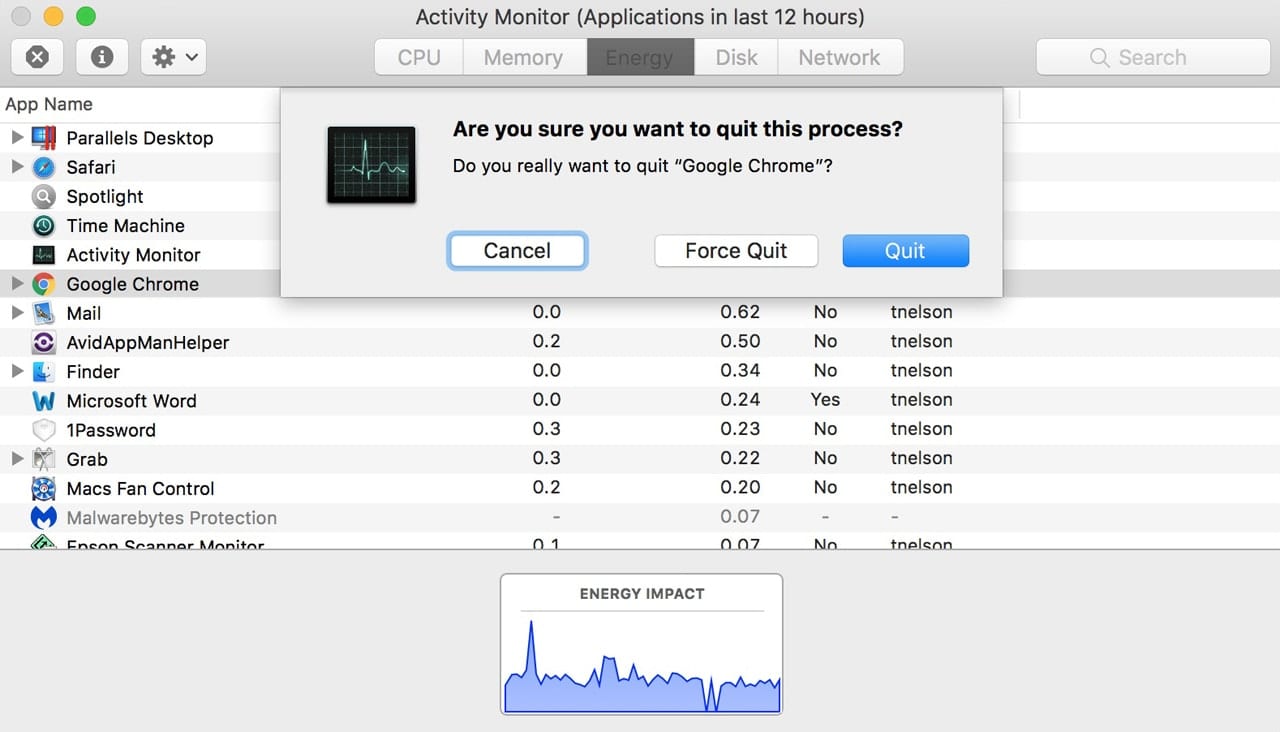
To terminate a process, select the process from the Activity Monitor list, then click the X button in the top left corner of the Activity Monitor window.
A sheet will drop down, asking if you really wish to quit “name of selected app.”
You can choose Quit or Force Quit:
- Quit: Terminates the app in a controlled manner. This form of quitting is similar to selecting the Quit option directly from within the app.
- Force Quit: Terminate the app without regard for open files, ports, or connections to other services. This is similar to using Force Quit when an app is frozen or unresponsive.
Note: Both the Quit and Force Quit options can lead to data loss if the app has not recently performed a save.
Make your selection and click either the Quit or Force Quit button.
Info
Activity Monitor can provide additional information about each process. Select a process from the list, and then click the Info button (a circle with a letter “i” in the middle) located at the top left of the Activity Monitor window.
A window will open, displaying more detailed information about the selected process. You can view additional details about memory usage, statistics, including the number of calls to the system, threads in use, CPU time, and much more. You can also see which files and ports have been opened by the app.
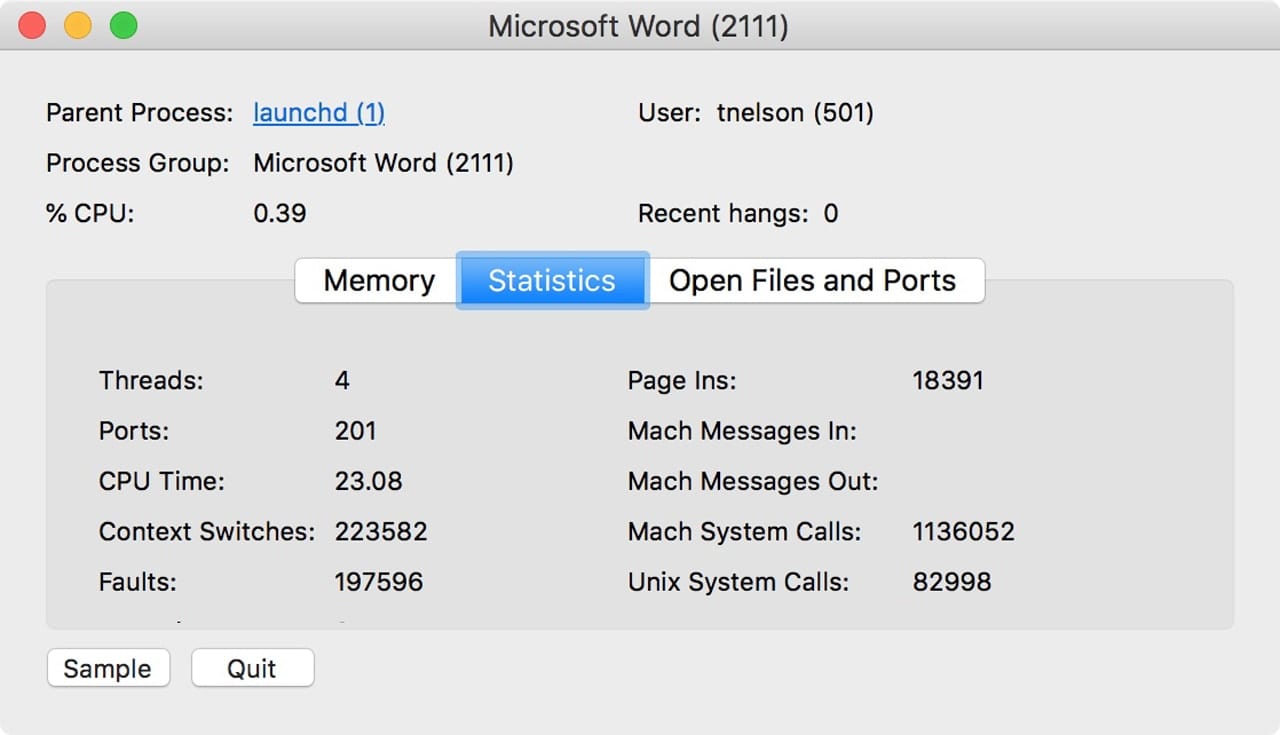
The Info display can be helpful in troubleshooting process issues, especially the Open Files and Ports. Ever want to know where an app’s plist is located, or which fonts it’s using? You can sometimes find out by examining which files the app has opened. Activity Monitor can be a very helpful utility. If you’re using the app, let us know in the comments below what the app has done for you.


One thing not identified is the GPU RAM usage… wish there was a way to find out that info on a Mac.
I appreciate this information. I certainly learned more than I knew.
However, some of these features are newer. It may be irrelevant for most readers, but the ability to look at GPU details is more recent than Sierra (10.12).
I have a new 16inch MBP, I have the integrated GPU and the AMD Radeon Pro 5500M.
IN activity monitor I do not have the requires high perf gpu column in the energy tab and I can not add it from view – colours either.
Has my new £4k MBP been built wrong !?
You guys do such a wonderful job with every publication of “Rocket Yard Weekly.” I always look forward to reading your articles which are so well written and informative. This article on the Apple Activity Monitor application, which came to us in two parts, is no exception. So well done and such a great in-depth look at the application. I for one, appreciate your effort and applaud your staff for these most informative articles.
Thank you very much, Robert! We always do our best to publish a wide variety of content that can speak to a wide variety of people, and we always appreciate receiving positive feedback!
disk and network tells me totals but not which app is writing NOW or using the disk now. is there a way to sort by current activity?
Activity Monitor won’t do exactly what you want. But you can get an idea as long as the process is making large changes.
Set the Update Frequency to 1 sec.
Select the Disk tab.
Set the View to Active Processes.
Quit Activity Monitor (clears the Bytes Read and Bytes Written values).
Re-launch Activity Monitor.
Watch the top few processes and the Data or IO graph. When the graphs shows activity, the top processes in the list are the likely culprits.
It is not very exact. You may get more detailed results with the Terminal app using the following command:
sudo fs_usage -f diskio
You quit the command with Ctrl Z.
But fs-usage is going to show you each process accessing the drives, which will mostly be system processes, and the result is not sorted, so its not that great a utility on its own.
I think the app iStat Menus lists the top processes accessing the disks, which may be a better fit to what you want to do.
Tom
just following…